


TL;DR: Probably yes. Skip straight to the analysis.
Curious how much? We were too, so we teamed up with our friends over at PaperKarma to figure out quite how strong the correlation was between email subscriptions and real life paper mail.
Since our only job is to unsubscribe you from it, at Leave Me Alone we know a lot about email subscriptions. To help us do it more effectively, we maintain a few big datasets about which senders are the worst spammers.
In contrast, PaperKarma deals with physical mail. If you get junk to your home mailbox, PaperKarma lets you snap a photo of it, and automagically get unsubscribed. This means they have a bunch of cool data about the most spammy snail mail that we can combine with our own data.

Wait, why would this even be a thing?
We probably wouldn't expect a lot of big internet based companies to send you physical mail. No-one is getting a postcard from LinkedIn or Facebook for instance (while they are definitely spamming the crap out of our inboxes).
Email is a much cheaper and faster way of getting in front of eyeballs. Probably for this reason, if a company has access to your email then this is the medium they will choose to send you their junk.
That said, there are still a huge number of retailers whose main business comes from catalogue and mail order (yes really), and there's a lot less competition for consumers' attention via their physical mailbox. The average US household receives ~660 pieces of junk mail each year*, compared to the 2,500 junk emails each of us get during the same period †.
Given that these companies are so eager to sell you their products, be sure that they will take every opportunity to get their adverts into both your inboxes (and short-wired to your brain).
* Thanks PaperKarma for this worrying statistic :/
† And this is only including the emails that actually hit your inbox, not the stuff we don't see because it's blocked or filtered.
So is that what happens?
So now we've established means and motive, we took a look at the data. PaperKarma provided us with a big chunk of their naughty list - 10,000 of their worst spammers.
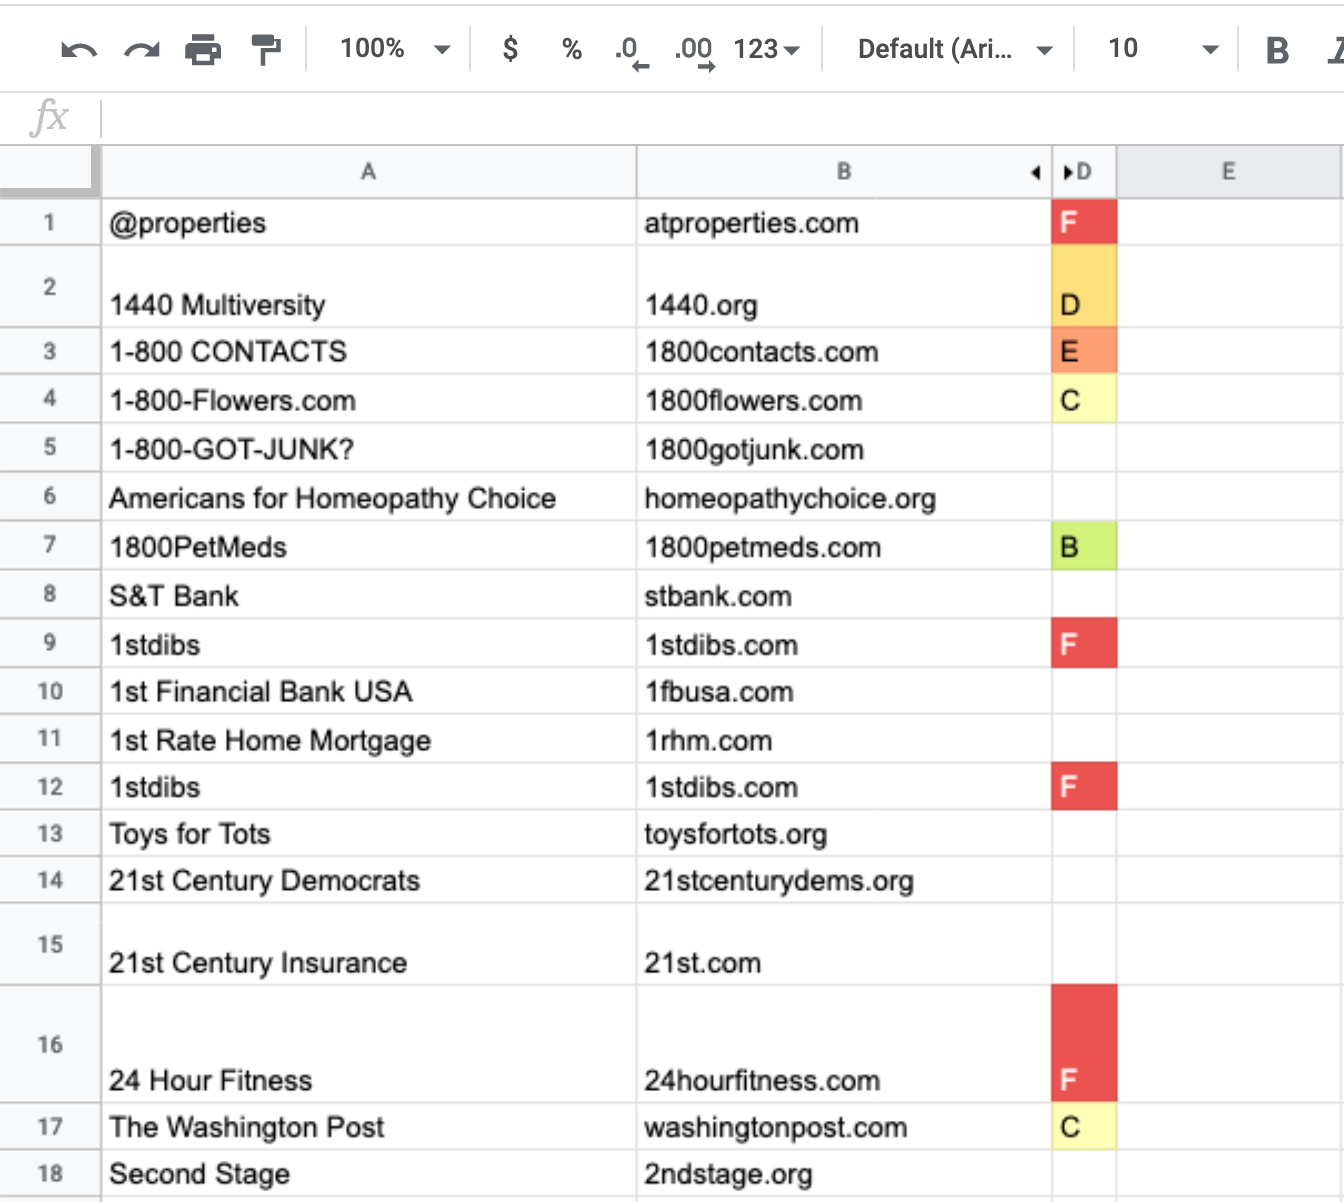
We loaded this data up into our data analysis platform of choice (ahem Google Sheets), and started picking through it. The PaperKarma data was all company names, and our data is obviously all about email addresses, so first we did a little domain discovery using the Clearbit API. Once we had the domains it was easy to check our database, grab the ranks and load these into the sheet.
From the 10k companies, we found a match with our data on 1637 of them‡. So about 1 in 6 of the snail mail senders are also sending subscription emails. That's cool, but we took it a step further, you can skip this next part if you don't care much for statistics!
‡ The Clearbit API only returned domains for about 65% of the companies, so this could probably be improved with some manual effort.
Stats!
Each of the email senders in our data is assigned a score based on various statistics such as how many emails they send, how many people unsubscribe from them, and how easy it is to unsubscribe. We then give each sender a percentile rank from F to A+. We do this to make it easier to see which emails to unsubscribe from in your inbox.
Because this is a global percentile, we know approximately how many of a random sample should fall into each grade category. For instance, 20% of senders will always have a B rank.
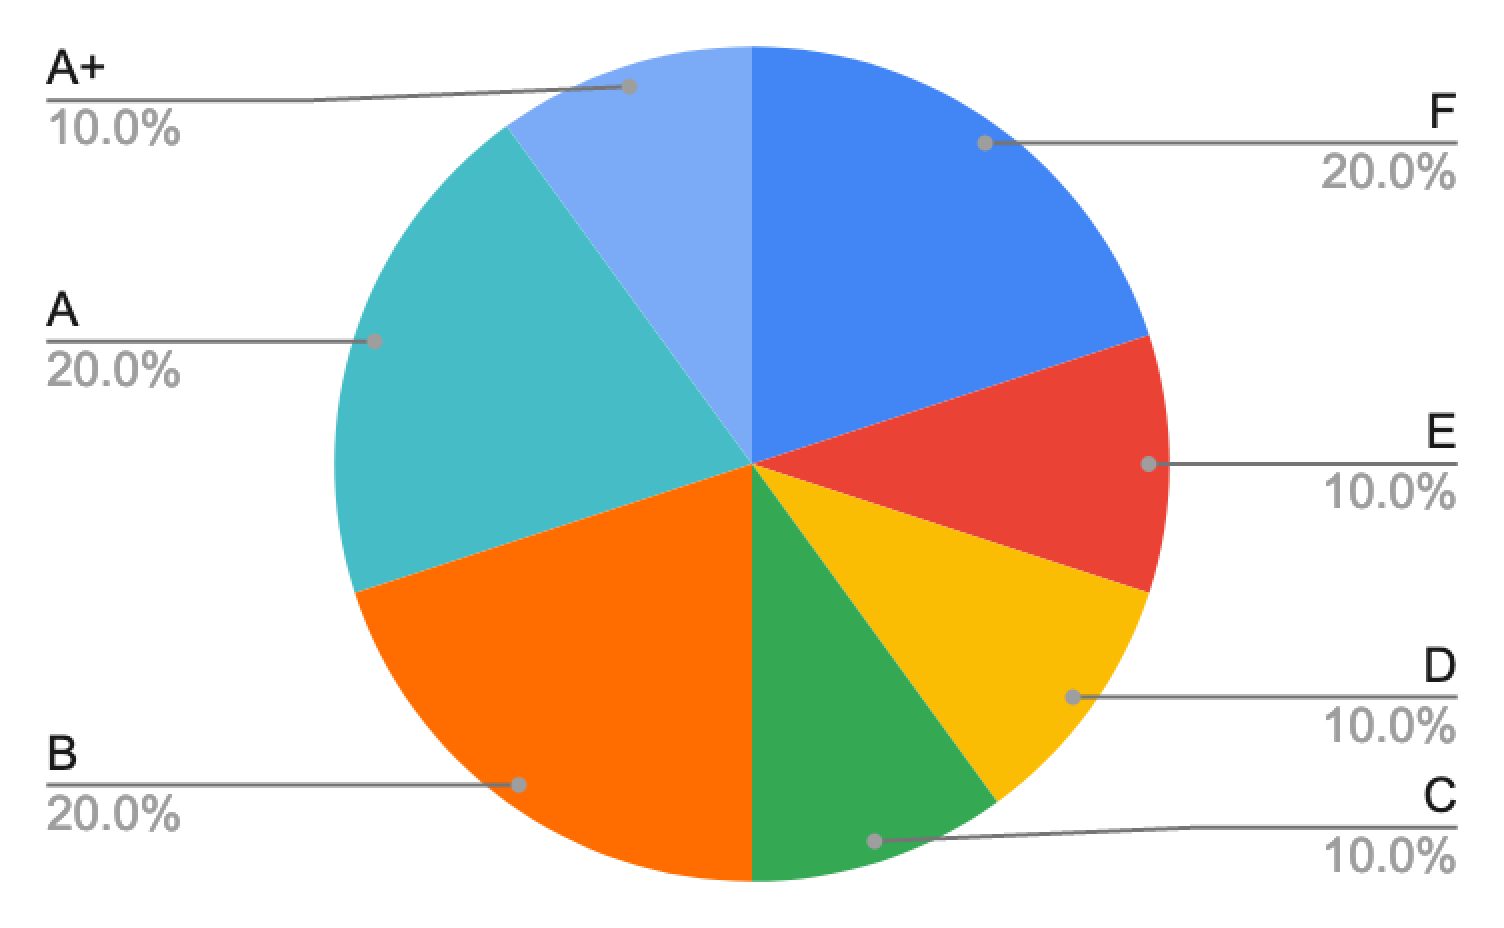
If we were to compare a random sampling of companies to our data, then we should see approximately the distribution as above.
However, since the PaperKarma data represents their worst senders, and we already know they send a lot of both snail mail and email, we should definitely see a trend towards the worse ranks, in other words, we should see more C, D, E, and F ranks than the above...
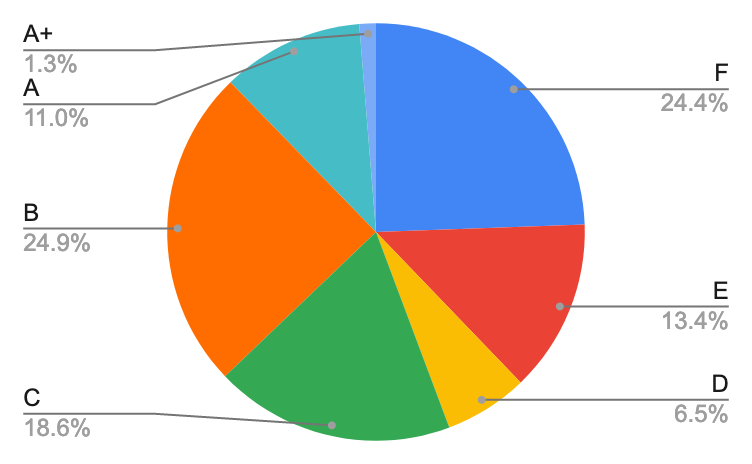
And yes, it looks like we do. There's a bunch more C, E, and F ranks, and a significantly smaller number of A+ and A ranks, suggesting some correlation between bad senders, regardless of the medium.
Conclusion
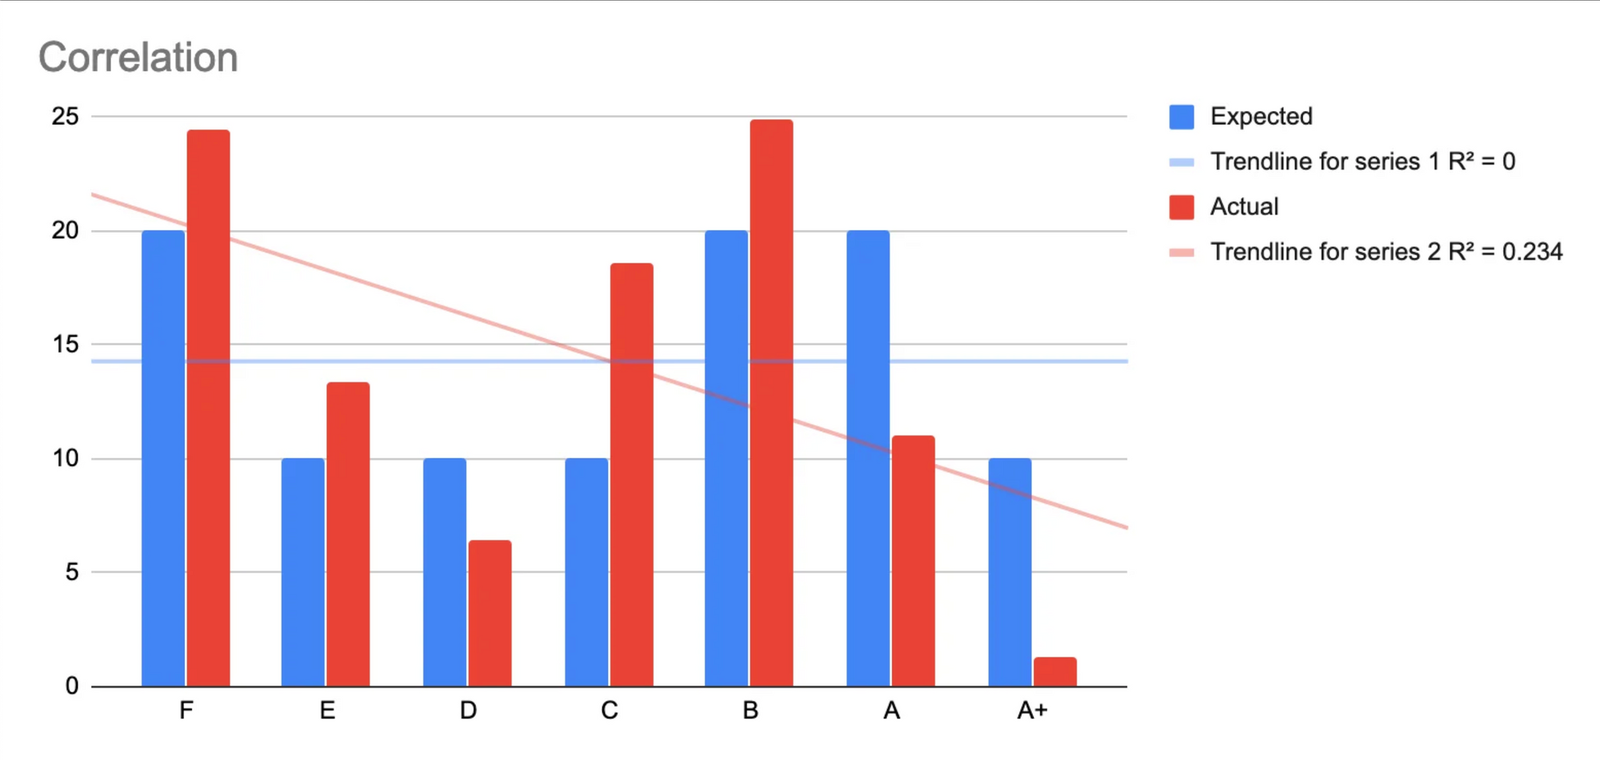
From the data we can demonstrate a slight positive correlation between spam email and spam snail mail, both in terms of the senders, and the "spaminess" rating of those senders.
If only there was some way to get rid of both email and physical spam in one go... well we can't quite offer that yet, but this has been a fun case study and we're looking forward to working with PaperKarma more closely in the future!
You can also check out our new product Subscription Score, that will let you check out the rankings of websites you visit and make your own comparisons :)
Thanks for reading! If you enjoyed this post then it would be awesome if you could spread the word with a like or a retweet below! 😊
Have you ever wondered if the same companies who spam you with post are also spamming you with email?
— James Ivings @ 🇱🇰 (@JamesIvings) February 27, 2020
We had an awesome opportunity this week to collaborate with @PaperKarma to try and figure this out, with data and stats and charts 🤓
Thread 👇 1/5 pic.twitter.com/FZUFVo8qr3
Follow the discussion on HackerNews, or subscribe for updates below!
